one of the concerns I have with the IDE is that it feels rather inert when you look at it.
nothing tells you at a glance what’s running or not, which nodes are eating your CPU, where data is flowing, where are the nulls, the big spread counts and so on and so forth.
for complex projects/libraries, this makes debugging horribly tedious. you end up creating IOBoxes to monitor stuff all over the place, placing WriteLine here and there to know when/if something happens. the fact that you can only look at one place at a time makes things even more complicated.
in a general way, I think it would help very much if the IDE gave more life-signs. I know that things were already asked in that direction, like here or here, but working on some intricate libraries and having those griefs again and again makes me realize that rather than making individual feature requests, it could be more beneficial to discuss the way the IDE communicates with us as more general topic.
and yes, I know we don’t want to have a cluttered interface and flashing stuff all over the place, and I also know that the UI revamp is going to happen at some point. let’s just see that topic as a place for suggestions and constructive reflections on that matter :)
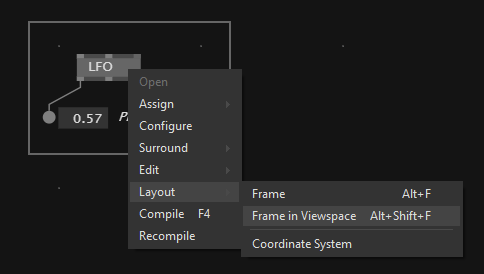
I’d be very happy if only I could place ndoes inside a Frame in Viewspace
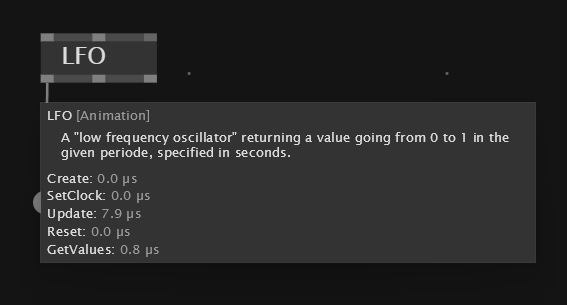
Even being able to see the advanced timing in Viewspace/Inspector etc would be amazing! Perhaps this way it will not be agains the aesthetic of the IDE…
In other words: Similar to any node, could a document have a tooltip, too? Something which a user does not need to look for it in patch like finding a spesific node, and not even in a seperated window like the Inspector.
It is located where it should be: inside the document! ;)
Yep. I could moan for days about this subject, but I’ll just make a single request: please show changes of an output on the link, not just hovering tool tip. This won’t work for mutable data of course but the activity and behaviour of a patch would be much easier to see.
Yep, that would already help a lot already, though I’m curious if “hiding” a Changed in all immutable links comes with performance issue? Maybe this could be a debug mode that one toggles on an off to note pollute/impact casual patching?
Another cool one would be to let the user know when an operation inside a class/process is executed. Maybe having small clocks next to each operation in the patch explorer could help? Like the clock on in an output’s tooltip, those could spin when the operation they relate to is executed.
I think its bound to, so it I imagine it being a thing that can be switched on and off. The benefit of a link is you can see both the source and the destination of a change, and if it goes to multiple sink nodes it could more of an overview. to be honest I’m greedy enough to want both ;-)
Being able to see how heavy your nodes are at the glance would also be very nice if I’m optimizing a patch. I’m not sure how I’d represent the timing but different colours are easier to distinguish than symbols or numbers presenting values…