
Hi everyone !
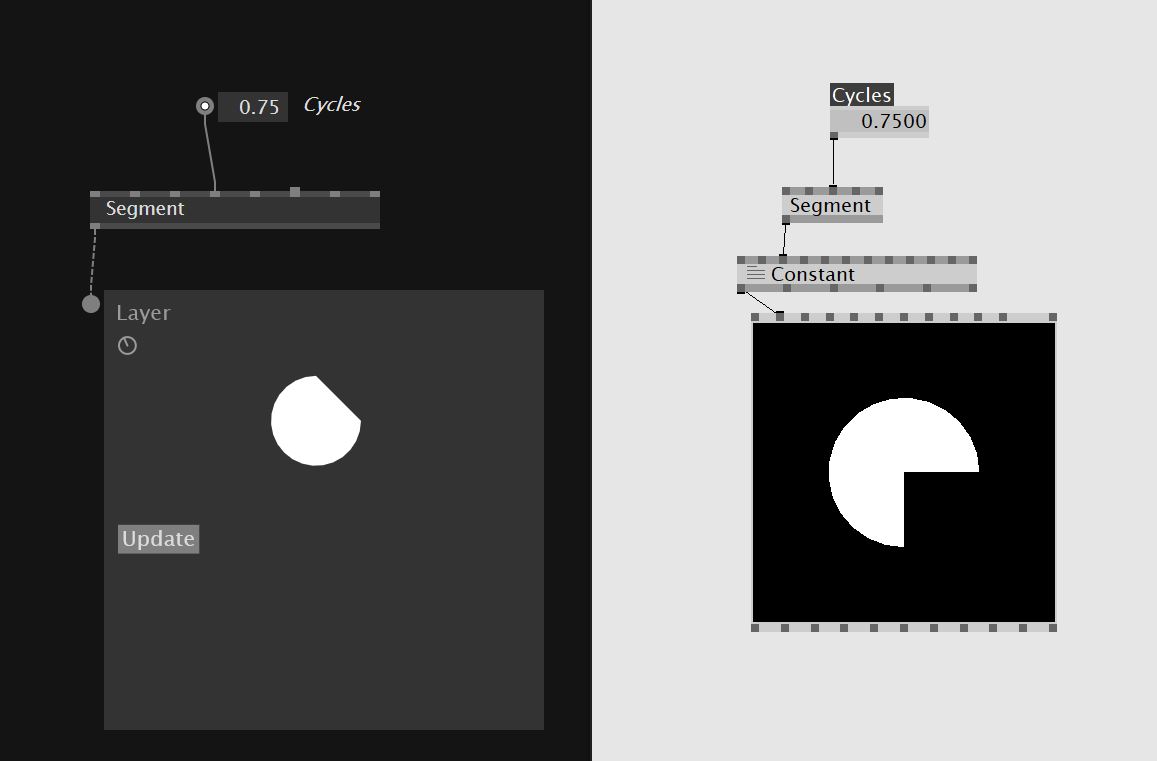
I’m using Gamma for a project that has to visualize many types of dataset and one of the viz is the pie chart. With Beta I’d use Segment but in Gamma the Segment cycles value behaves differently and I can’t have the pie chart with that… Any suggestion on how can I achieve that ?
Thanks !
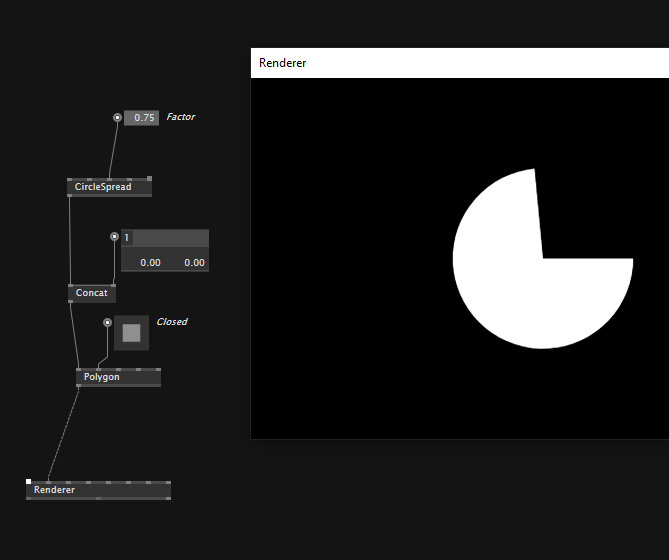
You could use the CircleSpread, make use of its factor pin, inject the center point of your circle at the end of its output coordinates, and use a Polygon to draw it.
edit:
well, it’s not the angle you would expect, but I’m sure it’s easy to figure it out.
ok, like in the Polygon (DX11.Geometry 2d) helppatch. had me confused too. is there a special reason why the new segment works that way? This concept is not very beginner friendly.
That’s it ! Thank you @readme
This topic was automatically closed 365 days after the last reply. New replies are no longer allowed.