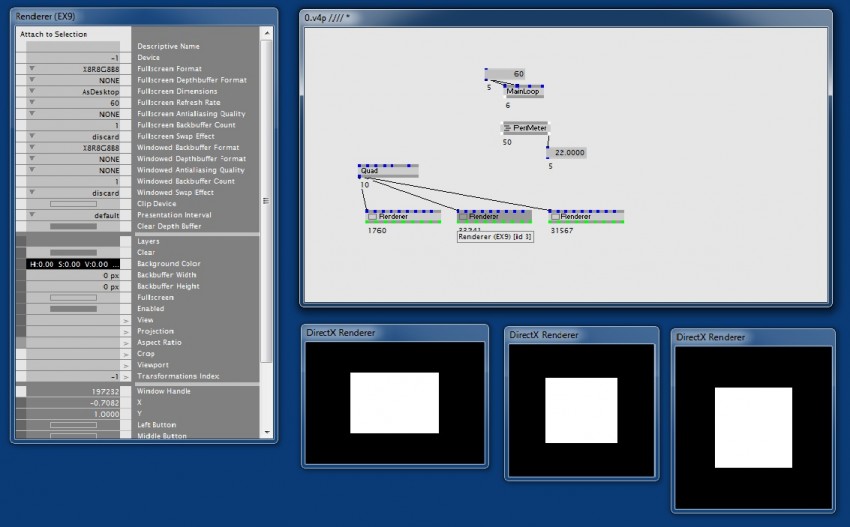
I’m not sure how this is connected, but I was running a patch mostly dx11, but using dx9 and a contour node to do some tracking, patch was dog slow, looking at the ticks showed dx9 renderer to be pulling 30000 ticks in debug mode, and the video texture running at 1000fps, which makes made me think you might be interested…
Deleting the renderer took my patch back to 50-60fps, from 10-15.
Changing the reference clock in the as video brought the video texture fps down to normal, but the renderer was still racing…
dx9 Renderer on its own and timing tells me the patch is running at 30fps
Update2, I disabled the intel display adapter in device manager, after checking with nvidia tool that it was on in desktop mode.
I can then create a quad and a renderer and see the quad in windowed and fullscreen!
However its still pulls 30000 ticks, and the aforementioned dx11/dx9 hybrid patch drops to 4fps
AH with intel disabled, my hybrid patch still only runs at 4fps, even after the dx9 renderer is deleted… Bugger! Not enough time to troubleshoot further, theres something very wrong in here somewhere!
SO I’ve just tried dx9 again with the intel disabled, but this time I’ve rebooted, and lo and behold dx9 in a window at 60fps, and in fullscreen, obviuosuly I wouldnt want to patch on a battery at this point, but patching v4 on a laptop not plugged in is always not a great idea as fans go full speed within seconds!
So, this for me is working, but I think zepi will still not be happy ;)
Oh what a laugh, so…
Disabling the intel gpu, makes dx9 apps work, but running a dx11 one, and the fps is 4 or 5 fps…
Enable the intel, but keep vvvv forced to use nvidia, and fps is back to normal, but no dx9
This is so weird…
I solved the black renderer issue just by deselecting “Clip Device” in the Renderer (by using the inspector). Works for me with optimus in both modes… using a DELL m3800
Ping! Yes that does seem to do it! My dx9 renderer still however pulls 15000 clicks with just a quad, against 30000 with the clip device active, or is that a mainloop thing?
What does clip device do?
good to hear and thanks marf for the pointer. it seems optimus drivers have their own interpretation of “clip device” that back in the days use to save performance rather than break things.
the idea with this setting was that rendering would be limited to one device even if you have a window spanning across 2 devices instead of using the cpu to transfer part of the image rendered on device 1 to device 2 (which drastically slowed down rendering years ago). probably not an issue anymore these days and i think we can now safely disable this by default. still waiting for zepis verdict…
deselecting “clip device” works for me too.
My laptop is a Dell XPS 15" / 750m
I think the same model as Zepi
Thank you marf !
Nice one marf that worked for me too.
wow! working!
great find marf!
I’m flabbergasted.
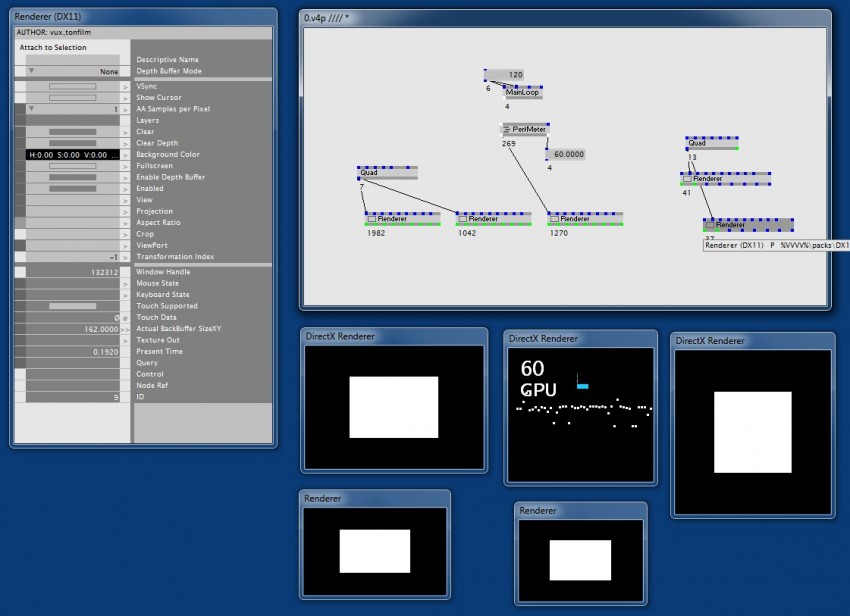
It goes down to a normal value (~1300) as soon as the patch has a mainloop node.

No relief for me. Win 7.
I’m testing some heavy patches with the latest alpha, win 8.1.
multiple renderers + external displays … no performance issues so far.
vvvverry good news.
Now this is skurril…
Zepis suggestion, setting the ML to 60 didn’t work out. However adding one or two DX11 Renderers raised the framerate, and now the costs of the DX9 Renderers are low :-) Maybe this is a dirty workaround.
weird indeed!
On my Windows 8.1 system the clicks of a DX9 Renderer (“clip device” disabled) instantly go down as soon as the mainloop has been set to 60fps.
latest alphas now have Clip Device off by default. since this seems to solve the most pressing issue of this thread i’m closing hereby closing it and would like to ask you to start a new thread with further issues.