
Hey all!
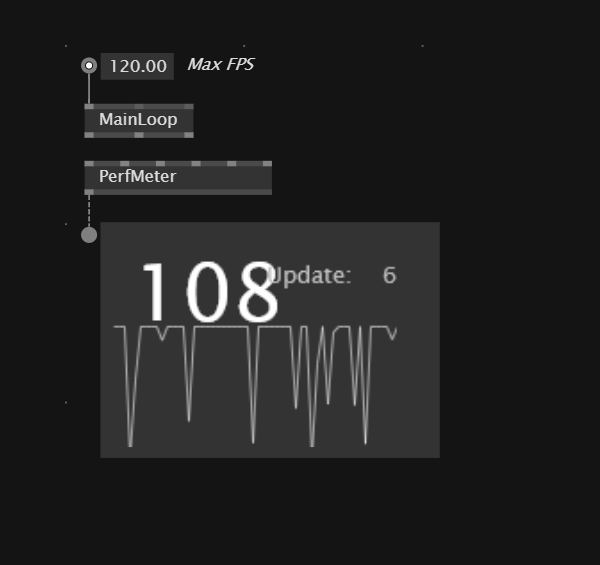
I am trying to optimize my LED Mapping patch as much as possible, and am having a hard time trying to understand the peaks I have in the PerfMeter (I am using PerfMeter from Graphics.Skia.Layer and a preview pad).
I know these tools are not necesarily the most accurate but I guess they are a good overview of the overall smoothness and/or culprits in a patch, and obviously something funny is happening under the hood here and I’d like to understand it better :)
Even after having optimized and cached every single thing I could in the processing, I am still seeing regular acute drops in the framerate like so, while I do not have anything happening at such a rate in my patch:
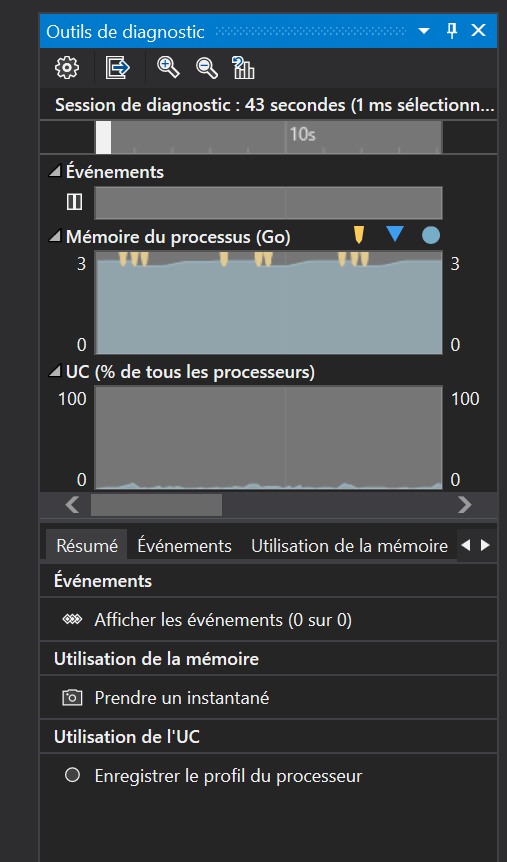
- based on recommendation from @sebescudie I tried to use the process inspector from Visual Studio (“attached without code” to vvvv.exe) to see if it could show a sync with the garbage collector, hopefully pointing at some clumsy instancing that might have remained overlooked somewhere. But the peaks don’t match the GC, that is shown to occur on a way less regular basis (the capture below might not show the most contrast with the PerfMeter curve above since both are pretty erratic here, but most of the time both really show no kind of correlation at all, with usually way more fps downpeaks than GC happening):
But here is where it gets funny:
- when I delete one by one every single node in my root patch, while it gives a little more relief to the overall framerate (progressing asymptotically around 120fps), the regular down peaks remain
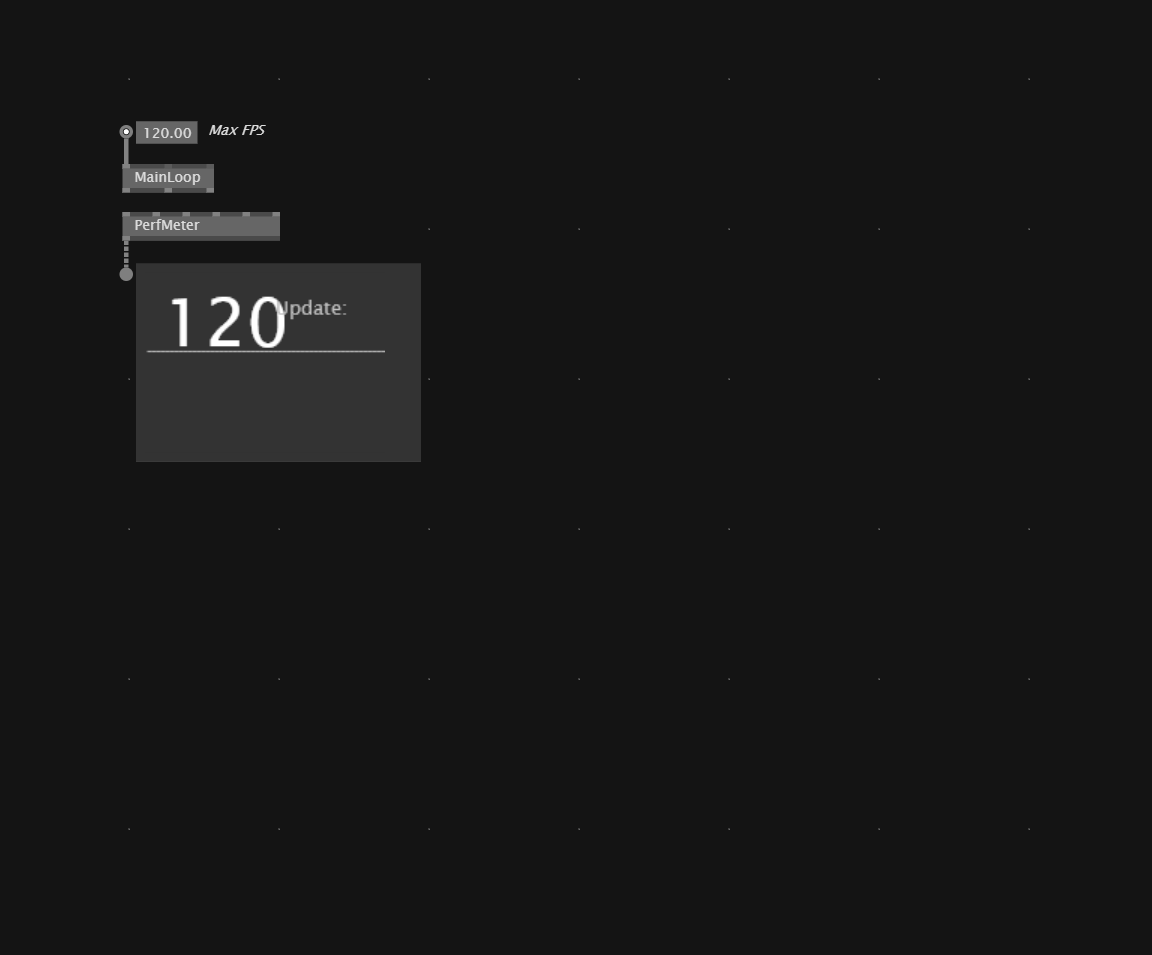
- even when I have deleted absolutely everything in my patch (except from the PerfMeter itself), the peaks remain (at a pretty intriguingly consistent rate)

-
from this blank canvas, F9 or even Recompiling won’t help
-
if (from the same vvvv active instance) I start a fresh new patch, paste only the PerfMeter, I still have the same curve
-
even (from the same vvvv active instance) if I close all patches, start a fresh new patch, paste the PerfMeter, F9, recompile, etc., the peaks are still here. Whatever I do, it seems the running instance is “doomed” forever with something in the background, in case I ever opened my big patch beforehand.
-
ONLY if I kill vvvv, start again a fresh instance, and paste PerfMeter in a patch, will I get a perfectly stable 120fps.
Does it make any sense?
Any idea what could be behind these pikes, surprisingly even as a zombie when no process node is even running anymore and the patch is even closed?
Is there any more targetted diagnostic tools or tricks I could use to track down the issue?
I’m trying to inverstigate quite thoroughly after suffering some regular freezes (5 secs or so) in my full patch that I cannot relate to any event happening in my processing.
I’m also seizing this opportunity to maybe get a little better at investigating deeper down how to optimize the perfs in a patch.
Thanks for the help!
T