I have a situation where I need to do linear regression inside vvvv. I have a bunch of points that are appearing along a more or less random path. I need to predict the direction they are appearing, so I need a line through the newest X points.
Does anybody know how to do this in vvvv? Is there some nodes that can help? Where to start?
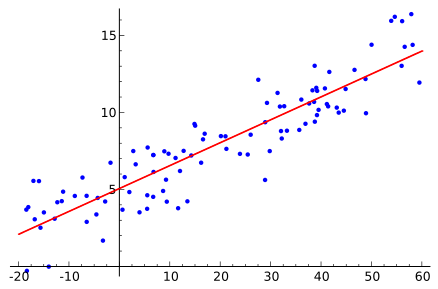
It basically looks like this in 3D. There are points that are appearing from left to right. I need to find that red line through the points. Its the average vector of where the points appear over time. Its a mathematical problem which can only be solved using matrix calculations. Im not sure how you would go about doing this in vvvv.
Incidentally I have a C# code for the problem from someone, but not really sure how to use this in vvvv.
It looks like this:
private void RunScript(List<Point3d> pts, ref object Curve)
{

Matrix M = new Matrix(2, 2);

M[0, 0] = 1;  M[1, 0] = 1;
M[0, 1] = -1;  M[1, 1] = -1;


M.Transpose();

List<double> dis = new List<double>();
double curDis = 0;

dis.Add(0); // d1 equals 0
curDis = pts[0].DistanceTo(pts[pts.Count - 1]);

for (int i = 1; i < pts.Count; i++)
{
  dis.Add(pts[i].DistanceTo(pts[0]));
}

Matrix T = new Matrix(pts.Count, 2);
for (int i = 0; i < pts.Count; i++)
{
  T[i, 0] = 1;
  T[i, 1] = (dis[i] / curDis);

}

Matrix X = new Matrix(1, pts.Count);
Matrix Y = new Matrix(1, pts.Count);
Matrix Z = new Matrix(1, pts.Count);

for (int i = 0; i < pts.Count; i++)
{
  X[0, i] = pts[i].X;
  Y[0, i] = pts[i].Y;
  Z[0, i] = pts[i].Z;
}

X.Transpose();
Y.Transpose();
Z.Transpose();


Matrix Ttrans = T.Duplicate();
Ttrans.Transpose();
Matrix CX,CY,CZ;
M.Invert(0);
Matrix TD = Ttrans * T;
TD.Invert(0);


CX = M * TD * Ttrans * X;
CY = M * TD * Ttrans * Y;
CZ = M * TD * Ttrans * Z;

List<Point3d> points = new List<Point3d>(4);

for (int i = 0; i < CX.RowCount; i++)
{
  points.Add(new Point3d(CX[i, 0], CY[i, 0], CZ[i, 0]));
}

Curve = NurbsCurve.Create(false, 1, points);
}
It still has some code in there that is specific to Rhino, but thats the goal. You give it a collection of points and it finds the best line through them.
I found this C# code for 2D linear regression and made a little plugin with help patch.
Check if that is what you need.
I’m not sure if I implemented the visualization of the slope right. :)
@microdee: actually no, the regression part i did not implement.
longer explanation: the accord-framework, on which the MachineLearning Pack is based on contains a huge amount of methods for machine learning, statistics, … and i put only a small part of it in the ML-pack (at that time i was mostly interested in the machine learning part).
it would be quite simple though to extend it for some regression nodes (reminder for myself: put the sources on github!), the methods are all there in the accord-framework.
@seltzdesign: there is one thing you can still do if you only need linear regression:
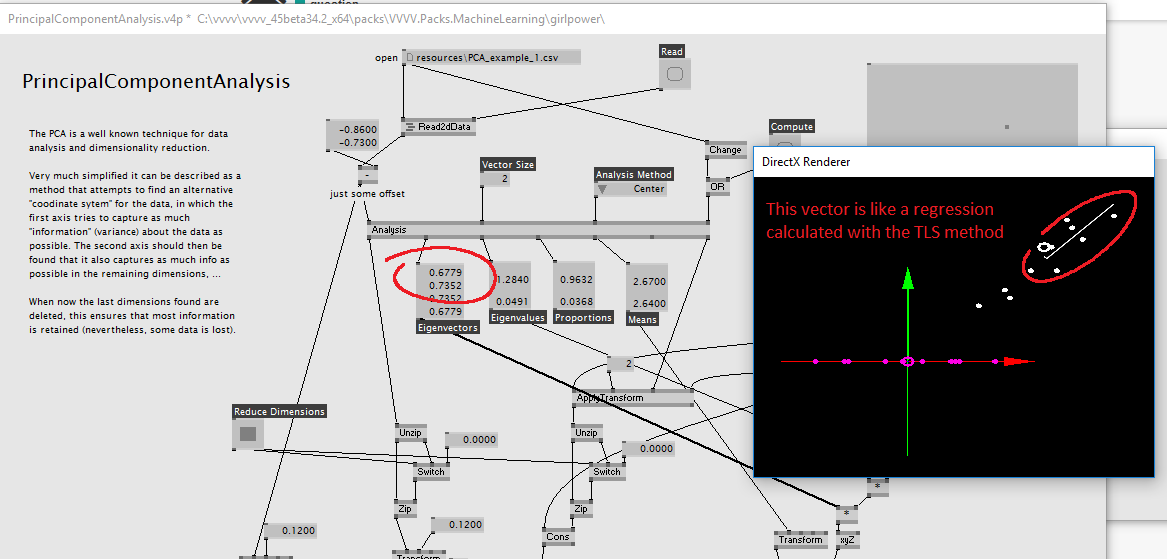
the Principal Component Analysis (PCA) method tries to remap your data to a new “coordinate system” in a way, that the first axis captures most of the variance of the data, the next axis is orthogonal and captures as much variance as possible in this dimension, …
the vector describing the first axis of this new coordinate system could be interpreted as a regression through your data. have a look at the PrincipalComponentAnalysis example in the ML-pack girlpower: the Eigenvectors you get from the Analysis node represent the “axis of the found coordinate systems”. so if you take the first components (2 or 3 depending on your dimensionality) you could interprete this as a regression.
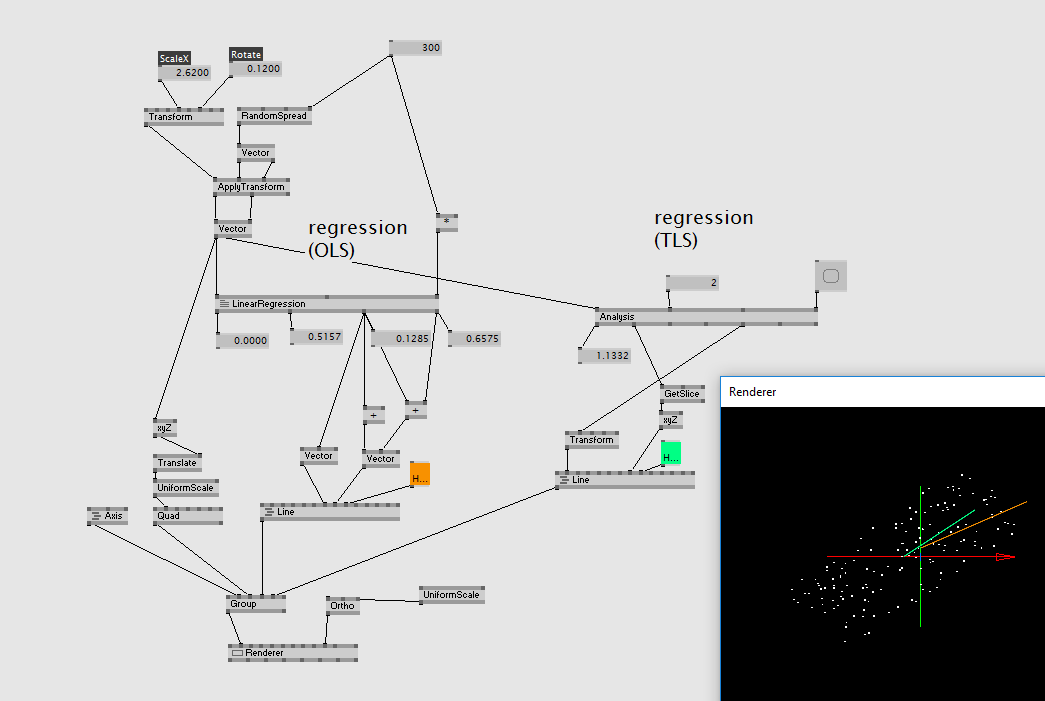
a side note: you can do regression using different methods. usually Ordinary Least Squares method is used to find the the result. but: this method might give different results when regressing x~y versus regressing y~x (depending on the variance in the two dimensions). the result of the PCA are different to the OLS method, but will be in between the regressing lines for the two different OLS methods. see here for a visual explanation (and also have a look at the comments, where it is mentioned that PCA is also used for finding the regression with Total Least Squared (TLS) method.
Thank you @id144, @motzi and @microdee for your suggestions, explanations and examples. It really helped a lot to understand and to achieve my goal.
In the end I went with the TLS method, as it appears to be more accurate, since the points can appear in any 3-dimensional direction. I now have fully 3-dimensional “predictive” movement of the camera interest, which uses the vector from the TLS calculation and the average distance between points over the last X points for the distance to move forward. This whole thing is necessary as I need to take the average of several of the points to calculate the camera interest, which is then usually “behind” the zone where new points appear.