Is there a way to see what parts of my patch is eating my performance without deleting and undoing all the time? something like what ctrl+F9 does in beta.
I cant find a more clever way in gamma
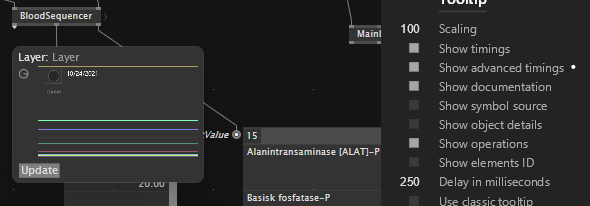
You can enable to show timings for each node in the tooltip via the settings: Debugging | vvvv gamma documentation
I can’t see any timings:
What if you hover the node rather than the pin?
I guess my confusion comes from expecting a behavior like in beta where there is a number on each node.
I would like to add that feature request, perhaps with some color highlighting where the horsepower is spent. Even though my patch is still small, it is difficult to get an overview of where the ineffectiveness is taking place.
Yeh, toggling a “heatmap” overlay would be cool for debugging!
6 Likes
Is it somehow possible to grab the timings of the currently visible node set via the vvvv API, or of all nodes plus the current patch position of the window?
This topic was automatically closed 365 days after the last reply. New replies are no longer allowed.