What’s happening in your workshop?
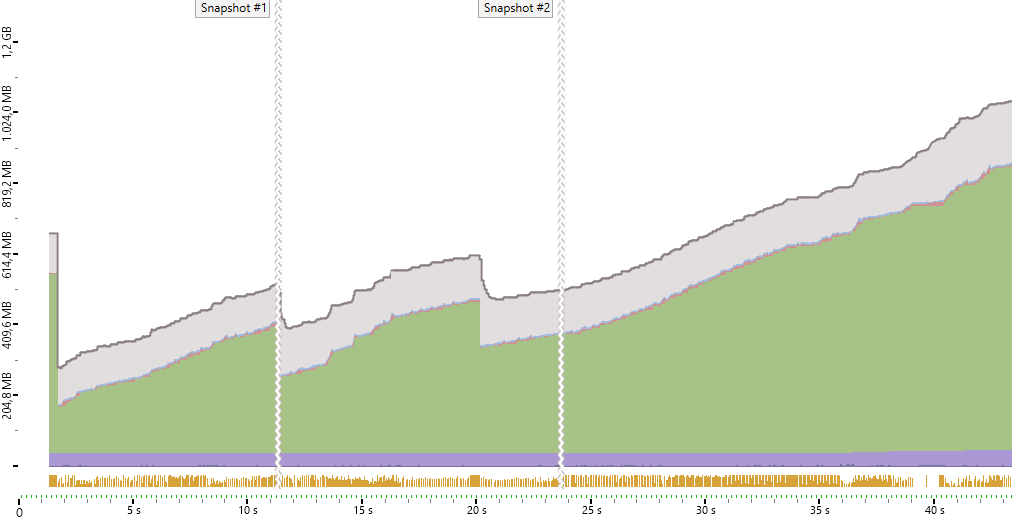
We’ll investigate performance and memory issues in patches using external tools like dotTrace and dotMemory. Once we understand the cause of those issues we’ll try to find ways to fix them.
What will people learn?
- How to find performance bottlenecks in a patch using a profiler like
dotTrace - How to track down memory leaks in a patch using a profiler like
dotMemory - What is garbage collection, how does it apply to my patches
- When to use mutable collections in order to avoid those large memory allocations
- What is so special about “resources”, what do we mean by that
- Why do we need to “dispose” stuff and probably more importantly - how?
Who is it for?
If you have a project/patch and don’t know why it performs so poorly or why it eats up all your memory over time.
What knowledge do you presume your participants have?
Words like class, record, mutable, immutable, object, instance, object graph, collections should be understood.
A session is 3h. How many sessions does your workshop need?
1
What’s the teaching level?
advanced
How do you qualify for the topic?
One of the developers of vvvv


