its me again :-)
i have a hopefully simple question - how to generate a heat map (like http://webtoolsandtips.com/wp-content/uploads/2007/12/heatmap.jpg) over several data points.
For example:
i have several data points with P(x,y,v) where as x,y are coordinates and v is a floatingpoint value. In my case i do not have a data point for each an every x,y coordinate, this is way i must do some kind of interpolaton between all those points. Is there a easy way to do so? I have found the trilinar interpolation but i cant figor out how to assure it to use my spread and generate the plane (which should be between all the points, or generate a huge plane where as only the values greater 0 are with color).
hopefully i have placed my questtion understandable - if not plz ask and i’ll try to redo my question.
this can be solved with B-Spline (Value) or Resample (Spreads). look at their help patches, they only work 1-D, so first you have to interpolate in one direction and then in the other…
you could also simply use the B-Spline (3d Surface), but it needs a lot of performance, as it does some more stuff than you need.
if you want to create texture colors like that, you can’t use this approach, because it would need too much performance. in that case i would just put the data that you have in a small texture side by side and draw it bigger, so that the graphics card does the interpolation for you. the Bicubic shader can help here. you could use a gray map, interpolate it and then color it in another shader…
anyways, here is a brute force patch using B-Spline:
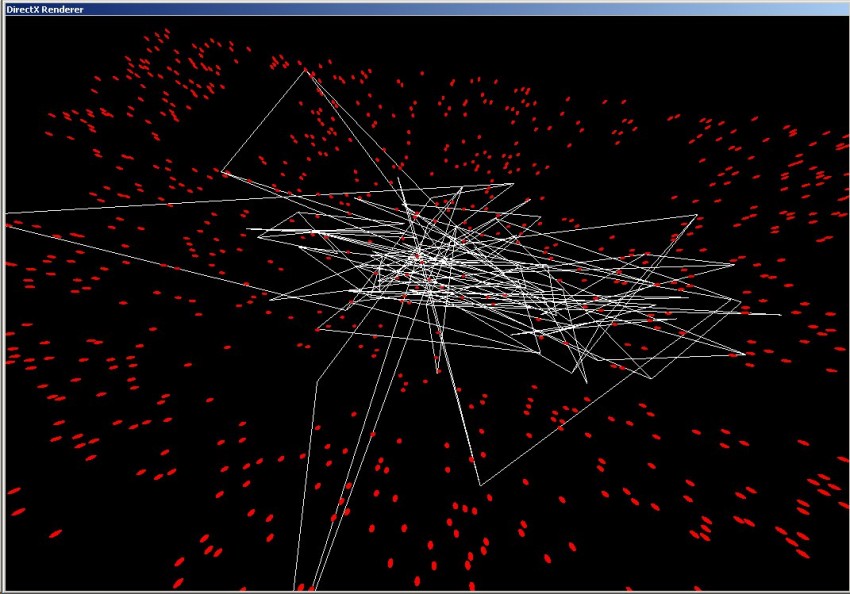
i have tried the b-spline(value) but i have some problems to interpolate over the whole scene. it just generates the interpolation for a specific area (i have really no clue why). playing around with the parameters makes it even worse. with you exampleeverything is working fine - but with my data set it is not really working :-(https://vvvv.org/sites/default/files/imagecache/large/images/bild.jpeg (white is the grid, red are the spheres (data points)) someone any idea what could be wrong.
yes, it looks like your points are in a total random order and that is twisting tha grid, because the grid of the B-Spline node expects the coordinates to be ordered by x and y.
can you upload your data somehow? the distribution of the x/y coordinates of your data also looks quite random… i would say it needs some treatment before you can use it.
and by the way, vvvv will do screenshots of the active window by pressing ctrl+2… ;)