Added scaling by mouse wheel just to see if I “get it”.
DraggableCircle_Strategy_Pattern_b.vl (79.8 KB)
Added scaling by mouse wheel just to see if I “get it”.
DraggableCircle_Strategy_Pattern_b.vl (79.8 KB)
this is also on update and has the same problem as the other patches. björns reactive version still wins :)
This combines both. The device input state should of course be something from the corelib, it was a bit cumbersome to do. I think Elementa also had to create its own input device state that was sent as a notification.
DraggableCircle_Strategy_Pattern_Reactive.vl (111.3 KB)
DraggableCircle_Strategy_Pattern_Reactive_Layers.vl (117.0 KB)
or
DraggableCircle_Reactive_simplified_Layer.vl (28.9 KB)
😬
björns approach still seems to be the best mix of perf/mainloop and flexibility.
“you just throw a whole node on another thread” would be the best ux imo.
here i gave it a go and structured it a bit:
DraggableCircle_Reactive_simplified_Layer_clean.vl (39.8 KB)
Well… that escalated quickly.
how can i see the timing without hovering over the node ?
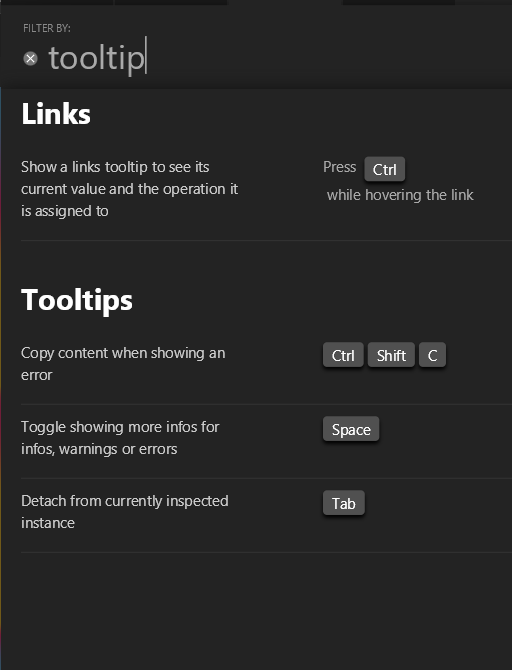
In the helpbrowser search for tooltip debugger, hover the node, pin the tooltip
but how can i pin the tooltip ? that was the question. i searched everything. no hint …
The timing should stay the same whether you interact or not. But good idea to check it.
Sorry. I answered from my phone. And it wasn’t quite accurate.
Warning: This may be seen a quirky workflow, but for now, it is the only way I know of how to measure the timings of a node while interacting in the renderer.
In the Help Browser in the “Learn” section, search for “Patch a Tooltip”
Hover the node in your patch
In that helper window: press “Click to pin”
When moving your mouse to that button, try not to hover any other pin or node
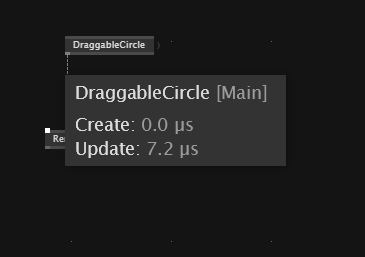
You now can see the timings and see how your node behaves when e.g. when dragging the circle.
Note however that asynchronous calls are not included. In your example, you were hovering the node DraggableCircle. It internally uses a reactive ForEach. Those calls inside that region are not taken into account. Profiling is an “art in itself” and we don’t have the toolset yet to easily compare the different approaches.
However, if you hover a node inside a reactive ForEach, it does show how the node gets called. In this case even several times between two frames - when the MainLoop is set to 1 fps:
If you don’t see the call count, but would like to: check the settings and enable advanced timings.
i don’t trust code , i always check things when interacting, you never know what crazy side effects might happen. just one example, in the early days of VL, interacting with a OSC based multitouch table killed VL/beta with too many touches.
took me a while to take this in, is this the only way ? there is only the tooltip timing on mouse over ? no debug mode planned or some kind of profiler like all the other kids have ?
it can look as simple as this
This thread is going a bit off-topic sorrily.
That’s why I called the current workflow “quirky”. It’s not the optimal workflow. We currently only show the timings in the tooltip, yes. But displaying those timings at other places is something we consider doing in the future. Sorrily, I can’t give you an estimate for when this feature will land. Up to that point, you have that quirky workflow as a fallback. :/
Didn’t check with a multi touch device, however had a brief look. It looked broken to me as well, but after installing WMPointer, I was able to get rid of the red nodes. Can you confirm? Is it working after installing?
This topic was automatically closed 365 days after the last reply. New replies are no longer allowed.


