By generating a slightly different target code, we managed to greatly improve the runtime performance when running inside the patch editor. Before these changes our system had to track the live instances in order to hotswap the running program.
With the new system we no longer need to track anything, instead the hotswapping code is kind of interleaved in the target code itself, swapping to a new program is basically just switching one pointer.
The new system will be available in upcoming .4 preview builds (>= 1086) and .5 preview builds (>= 177).
In general we’re very happy with the new design, internally it’s much simpler to handle (less corner cases) and also having to only switch one pointer to do the whole hotswap just feels right. Also the initial patch posted here (Glitchtest2) runs smoothly now. The second patch (Shuhbidu) doesn’t really benefit from these changes, for details see below.
It’s also worth mentioning that the target code of an exported application is NOT affected by these changes. The changes only affect patches running inside the editor.
Here is a comparison running the patches posted above. The first comparison (using dotMemory) shows the live memory usage over a period of around 2 minutes and the second comparison (using dotTrace) shows the time spent in garbage collections.
Glitchtest2
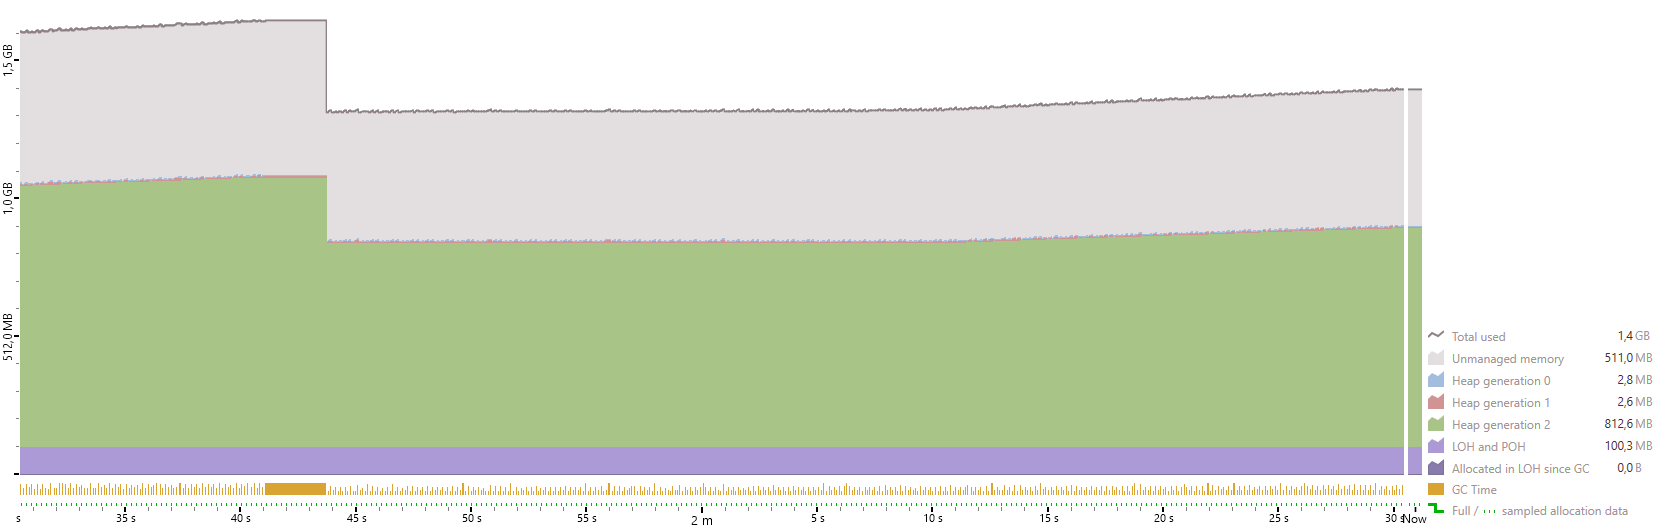
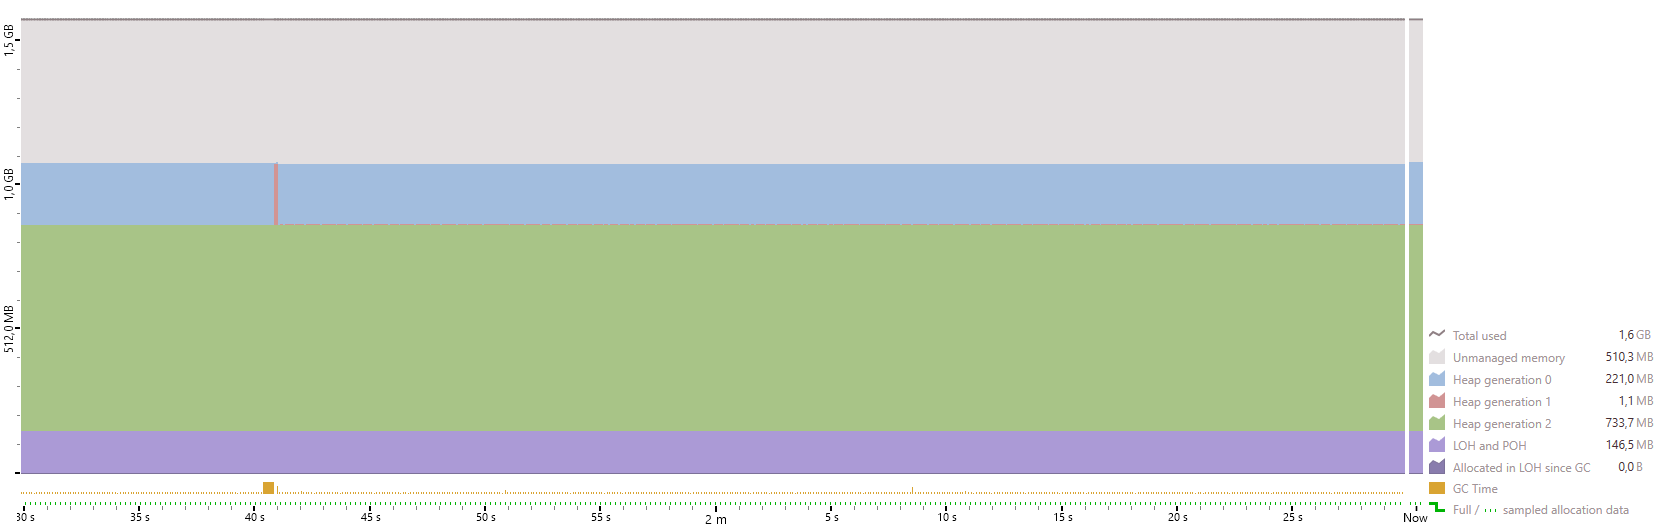
dotMemory
4.10
4.11-preview-1086
Much better and no glitches (was running it for 5 minutes). However when we attach the memory profiler the glitches start appearing again every 100 seconds. Detaching the memory profiler the glitches disappear. It seems the profiler causes some sort of hickup when a larger collection occurs.
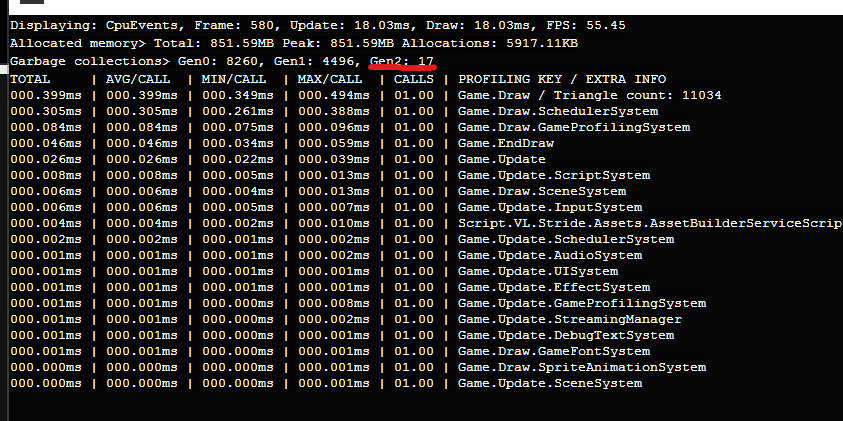
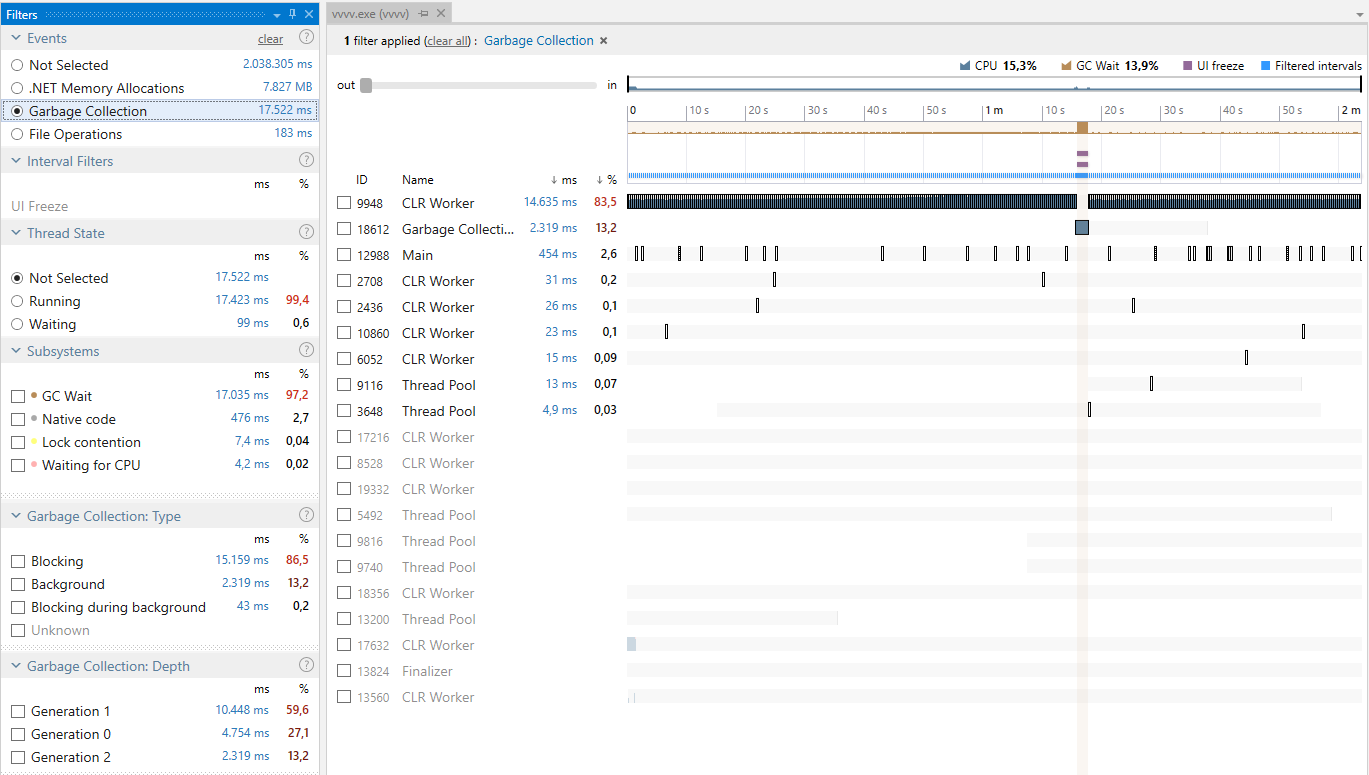
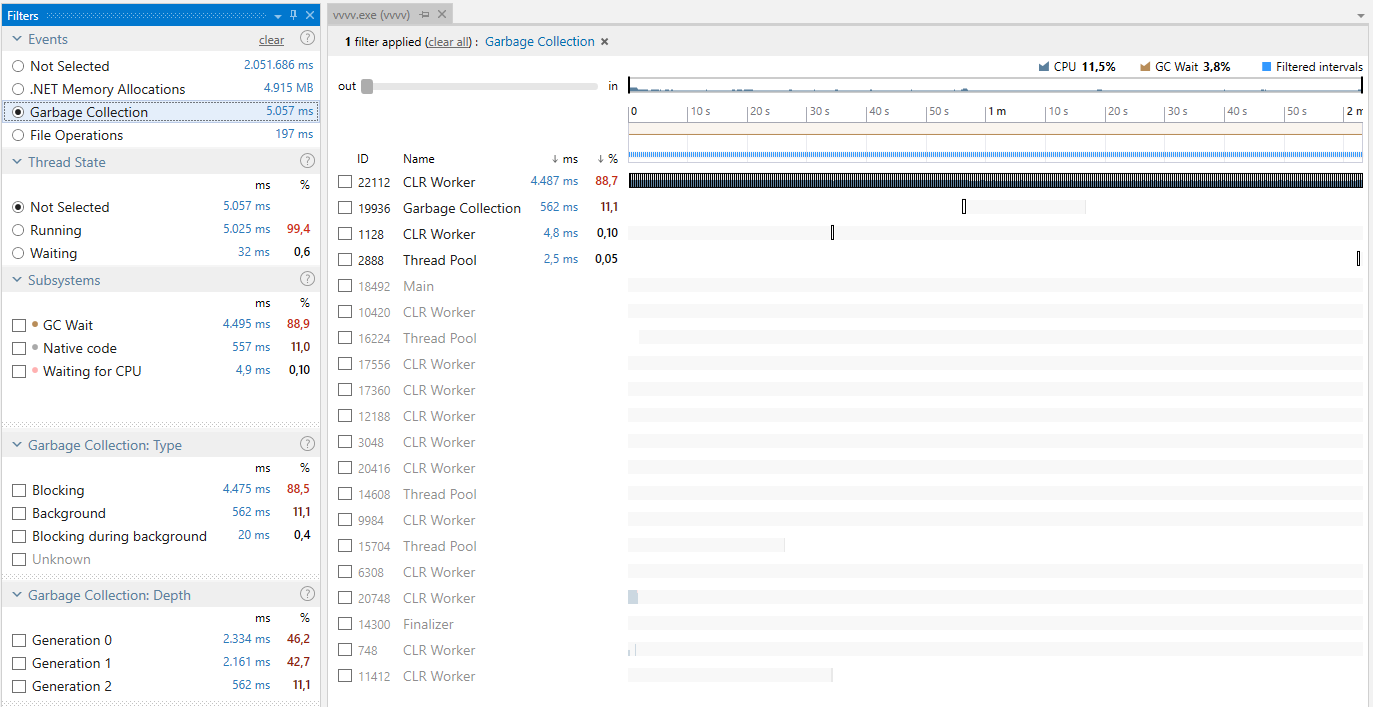
dotTrace
4.10
4.11-preview-1086
Using dotTrace we can see that the glitch is indeed caused by a garbage collection. In 4.10 that collection causes all threads to block (= glitch), while in 4.11 it doesn’t (= no glitch).
We can also see that the amount of time the system spends doing garbage collection is much lower (3.8% vs. 13.9%).
Shuhbidu
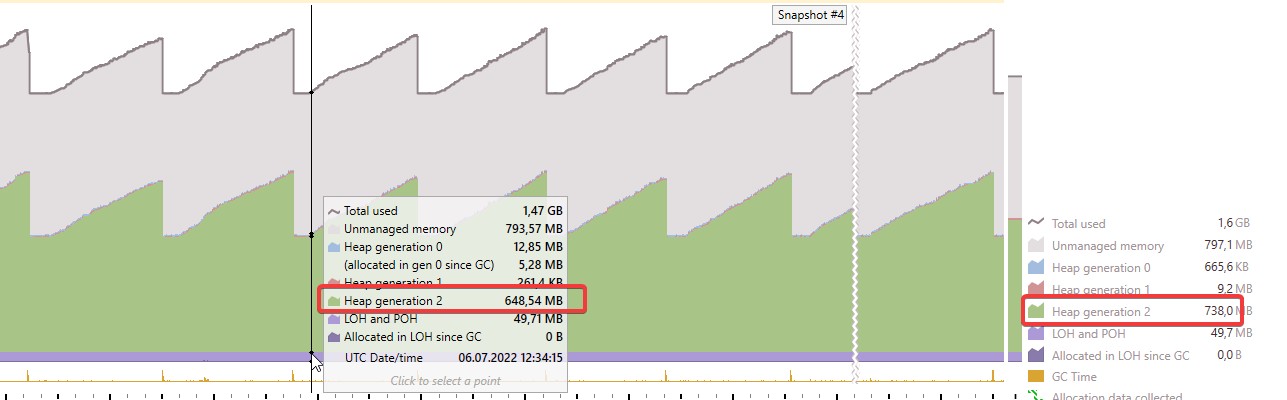
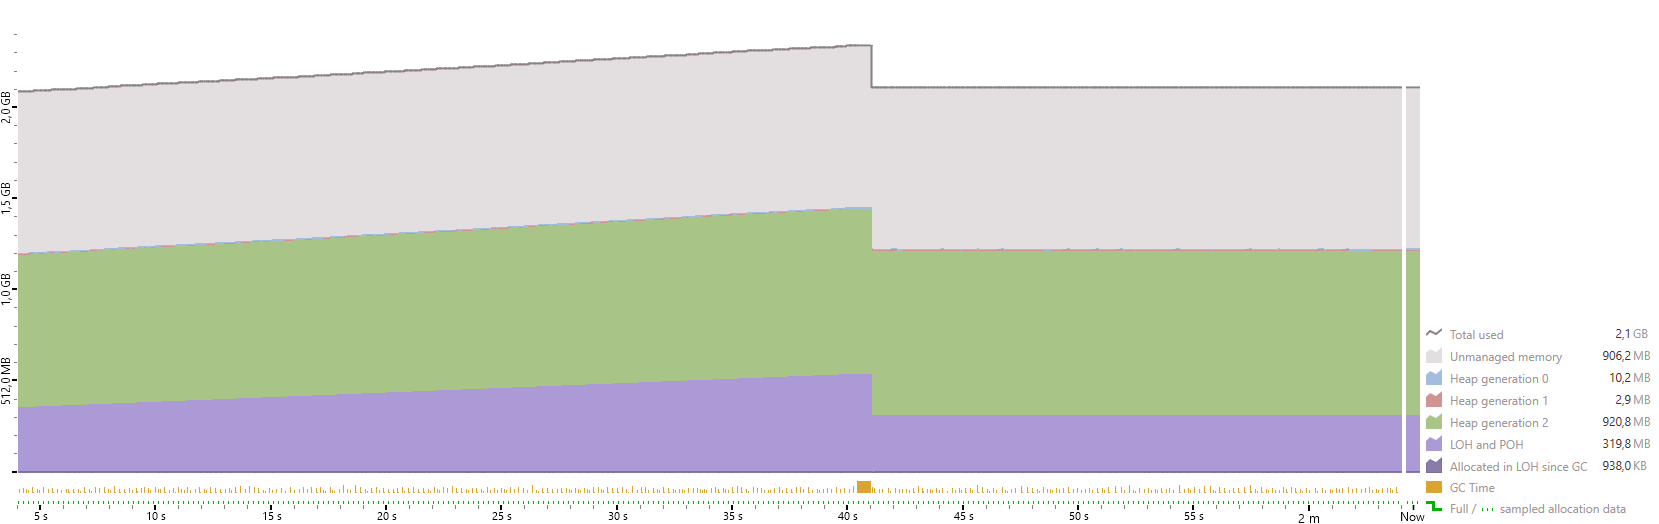
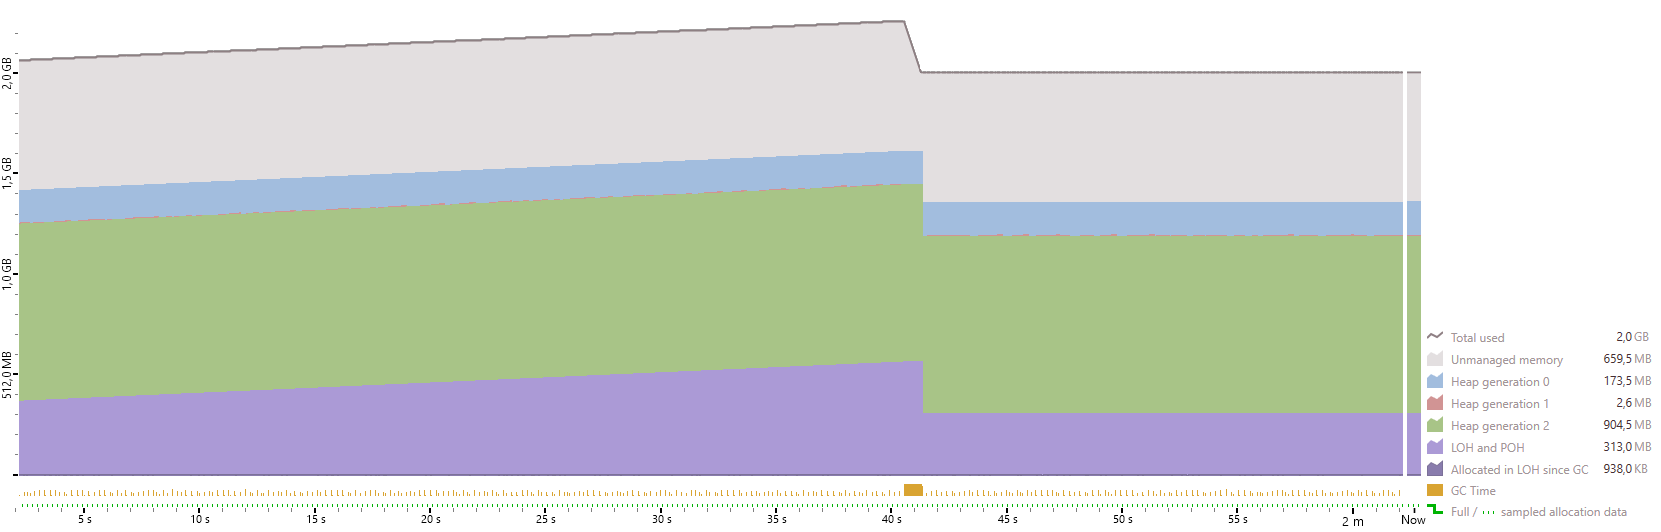
dotMemory
4.10
4.11-preview-1086
Not really much of a difference. This patch suffers from a different issue, it allocates large objects every frame. These allocations are visualized by the violet graph. An object is considered large if it has more than 85.000 bytes. Large objects are allocated in the large object heap (LOH), which only gets cleaned up by the rather expensive Gen2 collections. Therefor large object allocations every frame should be avoided. This can be achieved by re-using mutable collection types (like MutableList) instead of immutable ones (like Spread).
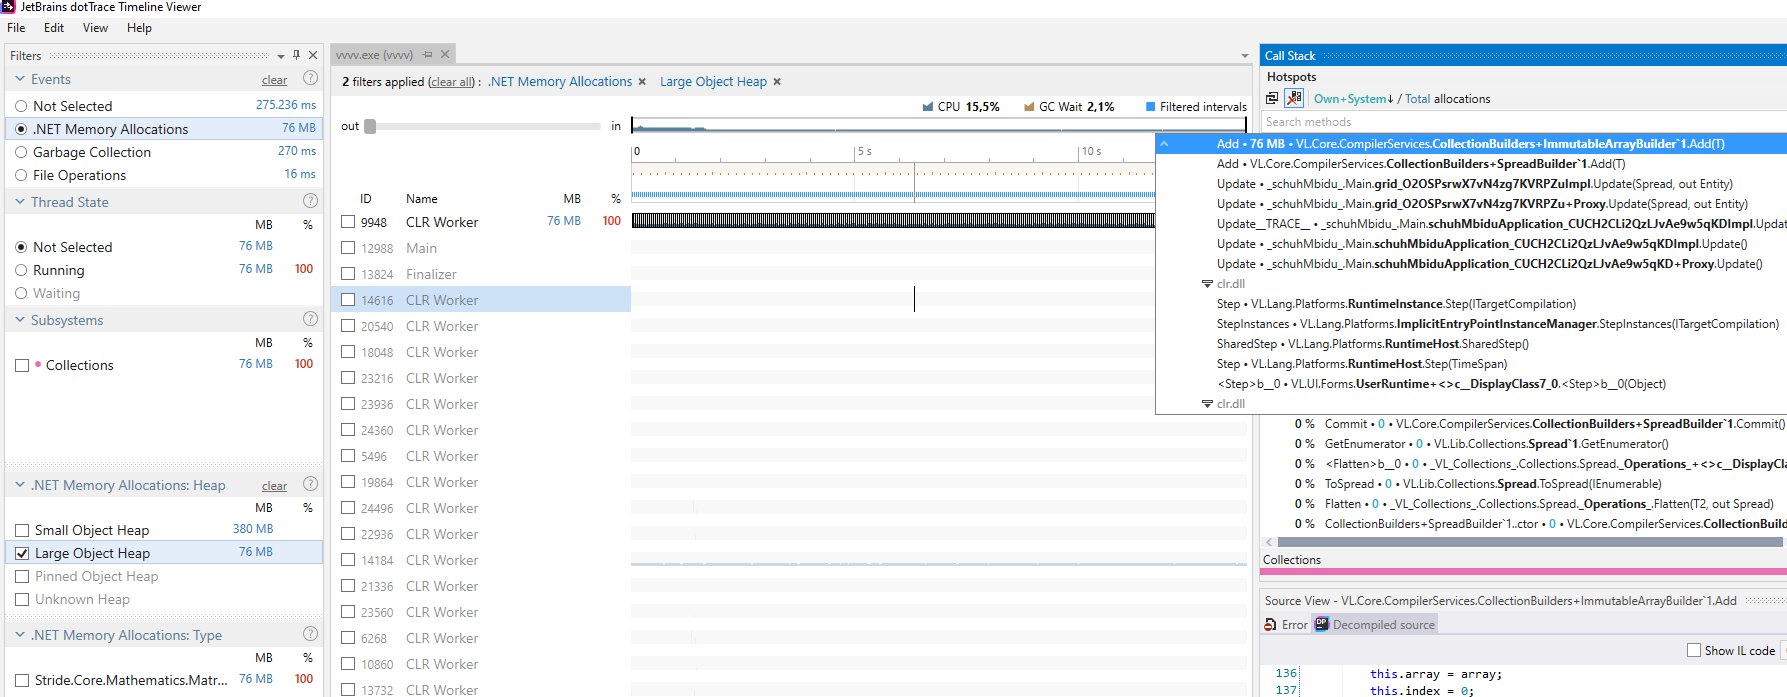
Now what part of the patch is responsible for the large allocations? That question can easily be answered by looking at it with dotTrace and setting the filters on memory and LOH:
Inside the grid patch we see that 1.500 matrices are created every frame (= 96.000 bytes > 85.000 bytes → large object). This part can be patched more efficiently by re-using a SpreadBuilder instead of the loop’s output splicer. Note though, that the downstream InstancingSpreadComponent currently forces the user to connect a spread, upcoming builds will fix that and will allow to connect any collection type.
In general one can say that the patch shows a weak spot in our current node/loop design. We should seriously consider moving to a mutable output collection type for our loops and also enforce the rule that inputs accept all kinds of collections. So that could be seen as the next chapter in the overall topic of reducing the pressure on the garbage collector.